Carbon accounting – We’re on it
Published:
Where are we in the Sustainability blog series?
The Christmas break gave me a chance to reflect on the blogs so far in 2021, a quick summary as follows;
- We’ve set the context of the overall climate challenge;
- We’ve introduced Mike Berners-Lee & the team we’re working with at Small World Consulting;
- We’ve shared the model we’re using to assess how ready we are for the low carbon transition;
- We’ve covered the first of the 8 criteria: Emissions Intensity.
This year I want to use the blogs to walk through the other seven criteria topics and this month it’s all about Carbon Accounting.
By Steve Foxley, CEO, University of Sheffield AMRC
Carbon Accounting – what’s our footprint?
Why is this an important topic for the University of Sheffield Advanced Manufacturing Research Centre? The reality is that the AMRC has carried out a series of positive climate change actions and investment decisions over the past decade to reduce its emissions, but prior to 2021 we had not carried out a full audit of our emissions. It’s important to do this so that we can explain how each action fits within our overall carbon footprint and net zero journey.
Having a quality carbon assessment is both key to understanding the baseline position (from which to plan out a net zero strategy) but also to allow us to adequately disclose our full operational and upstream emissions and the methodology we’ve used to estimate them.
Before Christmas we received our Carbon Emissions Report from the Carbon Trust and we had a chance to discuss and debate the results. I imagine some of you have already calculated your carbon footprints, but from my experience there are many more companies in similar positions to us who are trying to understand the current baseline position.
It was therefore important to us that we not only implement actions that reduce our carbon footprint but build on the high-level assessment of our carbon emission intensity from Small World Consulting, with a more granular analysis of our Scope 1, 2 and upstream Scope 3 emissions. For a quick recap of Scope 1,2 and 3 emissions see our blog from April.
We talked to a variety of suppliers and at the end of the process we decided to work with the Carbon Trust. In my experience, they’ve been brilliant. We’ve had plenty of discussions to set up the project, midway to discuss progress and in conclusion to understand the insights from our data.
Getting the project off on the right setting was key and given the peculiar nature of 2020 and 2021, we took benchmark data from our operations in 2019, prior to the Covid pandemic and the associated restrictions.
The headline data is as follows:
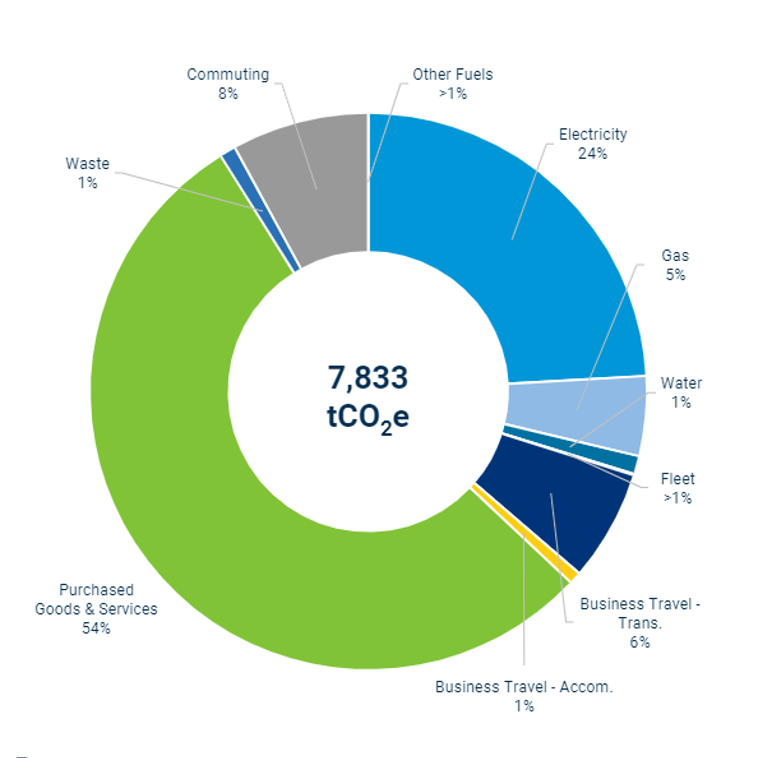
Total AMRC carbon footprint (Scope 1, 2 and 3) of 7,833 tonnes of carbon dioxide equivalent (tCO2e )
Broken down by scope:
• Scope 1 – 324.4 tCO2e (4%)
• Scope 2 – 1,527.6 tCO2e (20%)
• Scope 3 – 5,981.2 tCO2e (76%)
The first lesson I’d like to highlight is that most people tend to exclude calculating Scope 3 upstream emissions; simply, it’s very difficult to assess. However, my advice would be don’t fall into the trap of just looking at Scope 1 and 2. Having been through our experience with the team at the Carbon Trust I would strongly recommend giving it a go. Scope 3 emissions are crucial, as we found out through this exercise. Our Scope 3 emissions were significantly higher than we’d originally estimated.
The second lesson is that it’s also difficult to put a figure like 7,833 tCO2e into something meaningful. Most people use the rough calculation of how many cars this would take off the road if we got to a net zero position, or compare the figure to the average annual carbon footprint of a person in the UK. Trying to compare carbon footprints between businesses is challenging, as this is influenced by sector and by turnover and so I still find the peer / industry comparisons given to us by Small World Consulting useful (as explained in our October 2021 blog here).
Using benchmark figures of an average annual carbon footprint of a person in the UK being 13 tonnes, and the average annual UK car emissions (in use, excluding embodied emissions) of 4.6 tonnes, the comparison becomes:
• Scope 1 – 324.4 tCO2e, – that’s equivalent of emissions from 25 people, or 70 cars
• Scope 2 – 1,527.6 tCO2e – that’s equivalent of emissions from 118 people, or 332 cars
• Scope 3 – 5,981.2 tCO2e – that’s equivalent of emissions from 460 people, or 1,300 cars
The third lesson is understanding the top five drivers of our carbon emissions, which collectively account for 97% of our total emissions. The chart below shows our headline carbon footprint broken down by source, with our top five sources being: 1, Purchased Goods and Services; 2, Electricity; 3, Commuting; 4, Business Travel; and 5, Gas.
This analysis gives us a clear baseline from which we plan out our net zero pledge and targets (which will be covered by criteria three in next month’s blog) showing how we get to Net Zero across all three emissions scopes. Subsequent blogs on criteria three to eight will go into more detail on the specific actions behind our Net Zero targets but I wanted to share some of the interesting discussions that have arisen from our carbon accounting analysis.
More data
Electricity (2) and Gas (5): Even though we have a reasonable level of data transparency, we still need to put in place a system for collecting more granular data across the AMRC estate. We’ve discussed creating a platform for easy access to all submetering data for each building / group, together with the relevant Building Management System (BMS) data. We know we need this not only to help us optimise energy use but also to provide more detail on our gas consumption data as we look to further decarbonise heat and gas used for research activities. We are already discussing how to explore further on-site generation opportunities beyond the wind turbine and ground source heat systems we have already.
Purchased Goods and Services (1): Calculating our Scope 3 emissions was difficult but we did this assessment based upon our procurement spend data combined with the relevant environmentally extended input-output (EEIO) factors for each category. This gives us a certain level of transparency that will support several procurement initiatives being implemented in 2022 and support discussions with our key suppliers regarding their own Scope 1 and 2 carbon footprints. This gets us so far. To really understand our Scope 3 emissions, we will move to an assessment using a market based approach for supply chain emissions.
Insights from Covid-19 pandemic
Commute (3) and Business travel (4): Dr Alexei Winter from our Factory 2050 team has done some analysis of the impact of our hybrid working pilot scheme which rolled out in September 2021. Since implementing hybrid working, the Factory 2050 team has seen a 47% reduction in miles travelled, suggesting emissions have reduced from 152 kg/week to 81 kg/week.
Commuting transport options have historically been a challenge for the AMRC given its location and we’ve had many discussions over the past few years about this. There continues to be planning discussions for a train stop at Waverley. We’re keen to support this and wider opportunities to decarbonise transport options for our staff, including exploring electric vehicle (EV) incentive schemes and electric / hydrogen buses from the city centre.
We’re looking pragmatically at business travel as the Covid-19 pandemic has shown that alternatives to travelling to every meeting are available. There will always be a place for business travel given our international reach and the importance of face-to-face discussions, and yet we can make a meaningful reduction in our business travel emissions. We’re keen to encourage the use of rail for UK and European travel and off-setting for long haul flights where we deem virtual options are not feasible. In these situations, our main purpose for travelling will be to encourage innovation and collaboration that will help accelerate the low carbon transition and sustainable manufacturing internationally.
Next blog: Criteria 3 – Carbon Pledge and Strategy
Previous sustainability blogs:
Emissions Intensity > We’re on it